Technical analysis is super important if you want to trade crypto. It helps traders understand how prices move find trends and make choices based on facts, not feelings.
For beginners technical analysis might seem hard. With the right tools and approach its easier to learn. One of the popular tools used by traders is TradingView.
In this guide you’ll learn how to do crypto technical analysis step by step using TradingView in a way.
Table of Contents
What is Technical Analysis
analysis is when you look at price charts and market data to guess what prices will do next.
Of focusing on news or fundamentals technical analysis focuses on:
- Price history
- Chart patterns
- Indicators
- Market trends
The idea is that price movements follow patterns and by studying these patterns traders can make choices. You can try out charting tools. Practice analysis on TradingView.
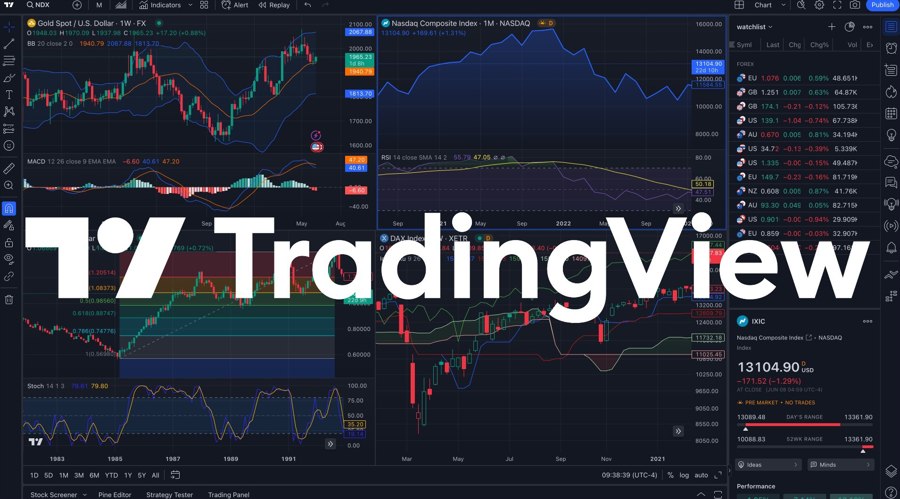
Why Use TradingView
TradingView is one of the powerful and easy-to-use platforms for chart analysis.
It offers:
- Real-time price charts
- indicators
- Drawing tools
- Community ideas and strategies
Its used by both beginners and pro traders.
Understanding the TradingView Interface
When you open TradingView you’ll see a chart interface.
Key elements include:
- Chart area where price movements are displayed
- Timeframes like 1 minute, 1 hour, 1 day
- Indicators section
Step 1: Choose a Cryptocurrency Pair
Before starting analysis pick the cryptocurrency you want to trade.
Examples include:
- BTC/USDT
- ETH/USDT
- SOL/USDT
Step 2: Set the Timeframe
Timeframe is important in analysis.
Common timeframes include:
- 5 minutes for short-term trading
- 1 hour for intraday trading
- 1 day for long-term analysis
Step 3: Look for Trend
The first step in analysis is identifying the trend.
There are three types of trends:
- Uptrend where price is making highs and higher lows
- Downtrend where price is making lower highs and lower lows
- Sideways trend where price moves in a range
Step 4: Draw Support and Resistance
Support and resistance are levels where price reacts.
Support is a level where price tends to stop falling
Resistance is a level where price tends to stop rising
You can use TradingView’s drawing tools to mark these levels on your chart.
Step 5: Use Indicators in tradingview
Indicators help confirm your analysis.
Some beginner-friendly indicators include:
- Moving Averages. Show the price over time and help identify trends
- MACD. Helps identify trend changes and momentum
Step 6: Analyze Volume
Volume shows how much of a cryptocurrency is being traded. High volume indicates interest while low volume suggests weak movement. Volume helps confirm whether a trend is strong or not.
Step 7: Look for Chart Patterns
Chart patterns are shapes formed by price movements.
Common patterns include:
- Head and shoulders
- top and double bottom
- Triangles
These patterns can indicate reversals or continuations in price. You can learn more about chart patterns on Binance Academy.
Step 8: Practice Risk Management
Technical analysis is not enough without risk management.
Always:
- Use stop-loss
- Avoid risking much capital
- Follow a clear strategy
Even the best analysis can fail so protecting your capital is important.
Common Mistakes Beginners Make
Avoid these mistakes while learning analysis:
- Using many indicators
- Ignoring the trend
- Trading without a plan
- Relying on indicators without understanding price action
How to Improve Your Skills
To become better at analysis:
- Practice daily on TradingView
- Study past charts and patterns
- Follow traders
Final Thoughts
Consistency is the key to improvement. By using tools like TradingView, identifying trends analyzing support and resistance and applying indicators beginners can start building confidence, in trading crypto. Remember, technical analysis takes time to master. Stay patient keep learning and focus on improvement.
Also Check Risk Management in Crypto Trading – Complete Guide 2026